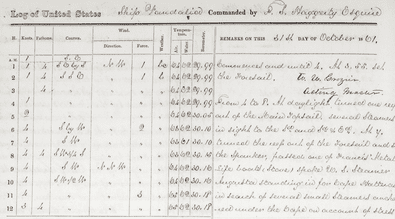
Reanalysis takes billions of past weather and ocean measurements, many recovered from ships’ logbooks, and uses them to produce a very detailed picture of the Earth’s weather and climate. The newest NOAA reanalysis does this eight times per day for every day since 1836 (so far). This takes a very sophisticated modeling system and some of the most powerful computers in the world.
But why go to all this trouble? There are two big reasons. Extreme weather events, which are the most dangerous and costly for people and society, don’t happen very often. This makes them hard to understand and predict. The only way to study rare events like these, as well as slowly evolving phenomena like climate change, is to have the longest and most complete view of the Earth’s climate system possible. Most importantly, the better that models can emulate past weather and climate, the greater confidence we have in projections of the future climate, and in the responses that need to be taken.
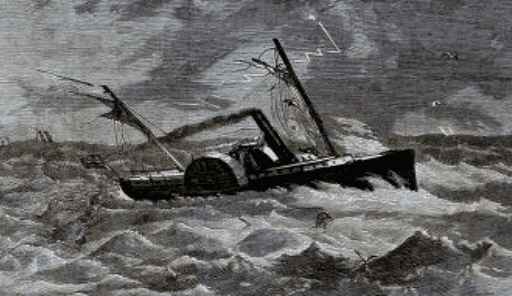
Extreme weather events are sometimes entwined with important events in history, and thus tend to be better documented. Scientists can use these cases to see how faithfully the weather is represented in the reanalysis, and historians gain a better understanding of its wider impact of history. A good example is a severe storm lately known as the Expedition Hurricane of 1861. If things had worked out slightly differently, it could have changed the course of the Civil War.
What centuries-old U.S. Navy logbooks in the National Archives are telling climate scientists about our past and how the earth’s climate is evolving over time.
Extreme weather events are sometimes entwined with important events in history, and thus tend to be better documented. Scientists can use these cases to see how faithfully the weather is represented in the reanalysis, and historians gain a better understanding of its wider impact of history. A good example is a severe storm lately known as the Expedition Hurricane of 1861. If things had worked out slightly differently, it could have changed the course of the Civil War.
This animation shows the life-cycle of the Expedition storm reconstructed by the NOAA reanalysis, beginning from its formation in the Gulf of Mexico on October 28, 1861 until it disappeared a week later off the coast of Canada. The shape of the storm is revealed by the large amount of water in the air, shown in shades of red and blue. NOAA Physical Sciences Laboratory.
The initial impact of the storm on the Great Naval Expedition was heavy. The commander, Flag-Officer S.F. Du Pont, reported “On Friday, the first of November, rough weather soon increased into a gale, and we had to encounter one of great violence from the south-east, a portion of which appeared to be a hurricane. The fleet was utterly dispersed, and on Saturday morning one sail only was in sight.”
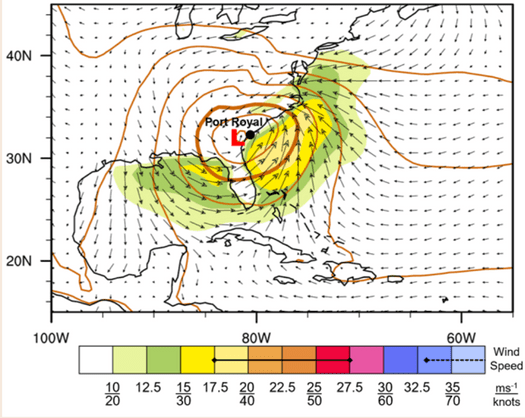
This map shows how strong the winds were at one o’clock in the morning of November 2nd,
when the storm passed over the ships of the Great Expedition and they were in the greatest danger.
NOAA Physical Sciences Laboratory.
At the height of the storm, the ship logbooks of the Great Naval Expedition record wind force at 8-10 on the Beaufort Scale (black line within the color scale), which corresponds approximately to 35-55 knots (17.5-27.5 meters/second). This indicates the storm, while severe, did not reach hurricane force of at least 64 knots, as indicated by the dashed line in the color scale.
In the end, the storm delayed but did not significantly affect the outcome of the Great Expedition. Flag-Officer DuPont noted, “As the vessels rejoined [after the storm] reports came in of disasters. I expected to hear of many, but when the severity of the gale and the character of the vessels are considered, we have only cause for great thankfulness.” Port Royal, South Carolina, was captured and made into a Union naval base in the heart of the Confederacy. Four old and unseaworthy vessels were lost – two driven ashore on Cape Hatteras and two sunk, but their crews and all but seven Army troops survived. The damaged Winfield Scott made it safely into Port Royal. Had the storm been stronger the outcome could have been disastrous for the Union.
The logbooks and the reanalysis both show the storm was severe, but short of a full-scale hurricane. This suggests the reanalysis may be somewhat underestimating wind speed or perhaps the ships’ officers overestimated it in the dark tumult of the storm. In addition to the historical insight, this tells us the reanalysis is performing well in this case. As more historical data is recovered we’ll learn more about this episode and other extreme weather events in the past, and this will also show what has changed since then.
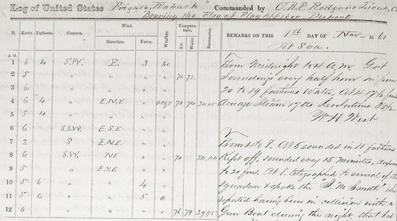
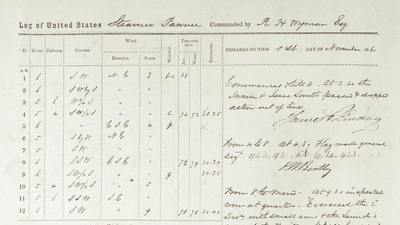
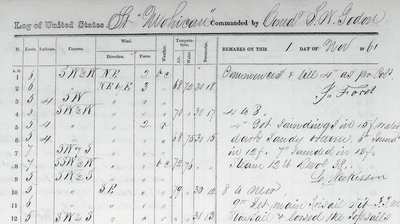
See how the Expedition Storm was described in Navy logbooks:
the flagship Wabash, the Pawnee, Mohican, and Vandalia.
Teachers, Find useful teaching tools and activities at:
Crafted by educators using documents from the National Archives.
This project is supported by a Digitizing Hidden Collections grant from the Council on Library and Information Resources (CLIR). The grant program is made possible by funding from The Andrew W. Mellon Foundation.
Join Old Weather | View and transcribe logbooks in the National Archives Catalog
Extended Citations + Links to original sources
Harpers Weekly, Nov. 30, 1861, p. 757. Internet Archive.
https://archive.org/details/harpersweeklyv5bonn
United States. Navy Dept., United States. Naval War Records Office. (1894-1922).
Official records of the Union and Confederate navies in the war of the rebellion.
Series 1, Volume 12. Washington: Govt. Print. Off.
https://hdl.handle.net/2027/njp.32101076897451
Kowalewski, A. The Storm that Nearly Lost the War. New York Times, November 2, 2011.
https://opinionator.blogs.nytimes.com/2011/11/02/the-storm-that-nearly-lost-the-war/


